Welcome!
This is the homepage and blog of Dr Caterina Constantinescu, Principal Data Consultant @ GlobalLogic.
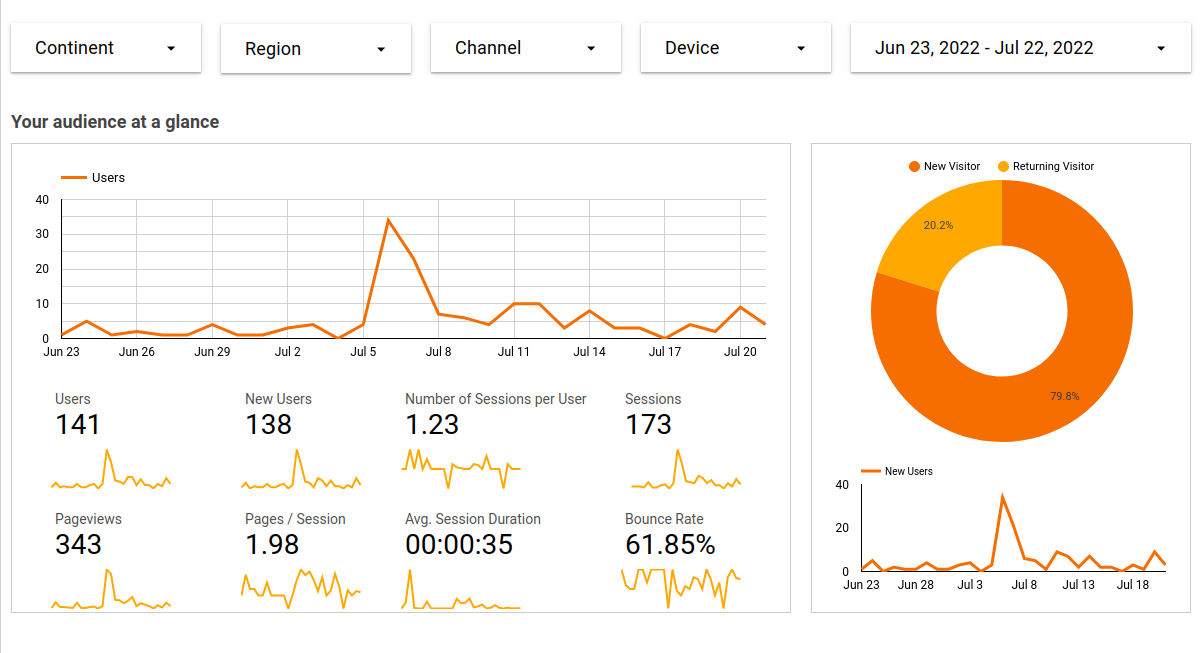
If you’ve wondered how page views may vary in response to website changes, you’ve come to the right place. Setting up your website around a GitHub repo (see options: Netlify + Hugo, and GitHub Pages + Jekyll) is a great way to ensure that this is a smooth process. The beauty of relying on GitHub to store your site is that you are creating an effortless log of site changes as you go, without having to devote attention to this as a separate process.
For this post, I’ve managed to find some extremely interesting historical event data offered by the Cline Center on this page. As you will see, this dataset can be quite challenging because of the sheer number of dimensions you could look at. With so many options, it becomes tricky to create visualisations with the ‘right’ level of granularity: not so high-level that any interesting patterns are obscured, but not too detailed and overcrowded either.
Following my previous post on how to use R remotely, I thought I’d follow up with a slightly more in-depth description for how to use R via vim, and with tmux. This discussion will focus on how to get things working on Linux (Ubuntu) - which is what I am using.
After installing all three of these:
Vim (version >= 8.0)
tmux
Nvim-R
we can proceed to do the following in a Terminal:
Why would you need to do this? Say, for instance, you are dealing with sensitive data that should not leave a specific system, or quite simply that you are away on a work retreat - but your laptop is far less powerful than your work desktop computer which you left behind - so you want to keep using it from a distance. For such reasons, I’ve been looking into what options are available to log in remotely to a machine and run R there for some analysis.
The 80/20 split Since project deadlines tend to be more or less fixed, the extent to which a dataset follows a set of commonly expected guidelines will often determine how much time you have left to spend thinking about your analysis. To use the split that everyone conventionally mentions, you would hope to spend a modest 20% of your time cleaning the data for a project, and 80% planning and carrying out your actual analysis.
I’ve recently come across data.gov — a huge resource for open data. At the time of writing, there are close to 17,000 freely available datasets stored there, including this one offered by the LAPD. Interestingly, this dataset includes almost 1.6M records of criminal activity occurring in LA since 2010 — all of them described according to a variety of measures (you can read about them here).
Using information like the date and time of a crime, its location (longitude & latitude), and the type of crime committed (among other things), you can come up with some pretty interesting visualizations.
 DataPowered


