Exploring transport routes, journey characteristics and postcode networks using R Shiny

Project aims
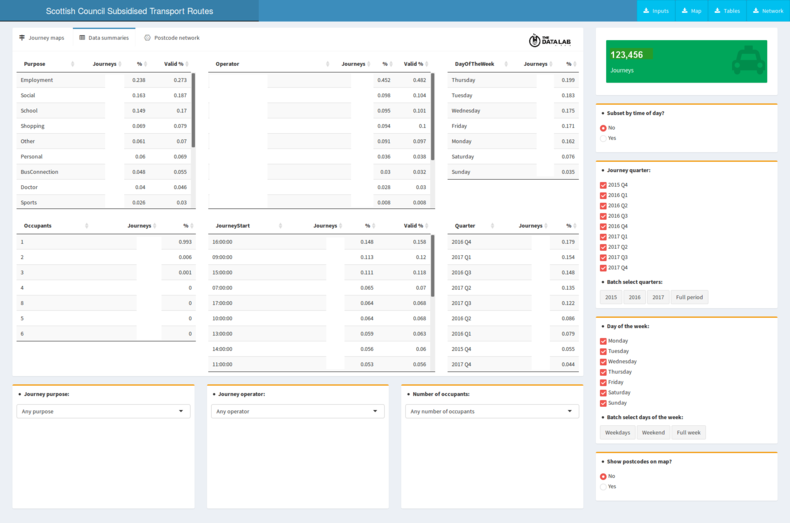
As part of The Data Lab, I worked on a project for visualising the traffic flow within a subsidised transport service, operated by a Scottish council. This visualisation needed to display variations in traffic flow conditional on factors such as the time of day, day of the week, journey purpose, as well as other criteria. The overall aim here was to explore and identify areas of particular activity, as well as provide some insight into how this transport service might be improved.
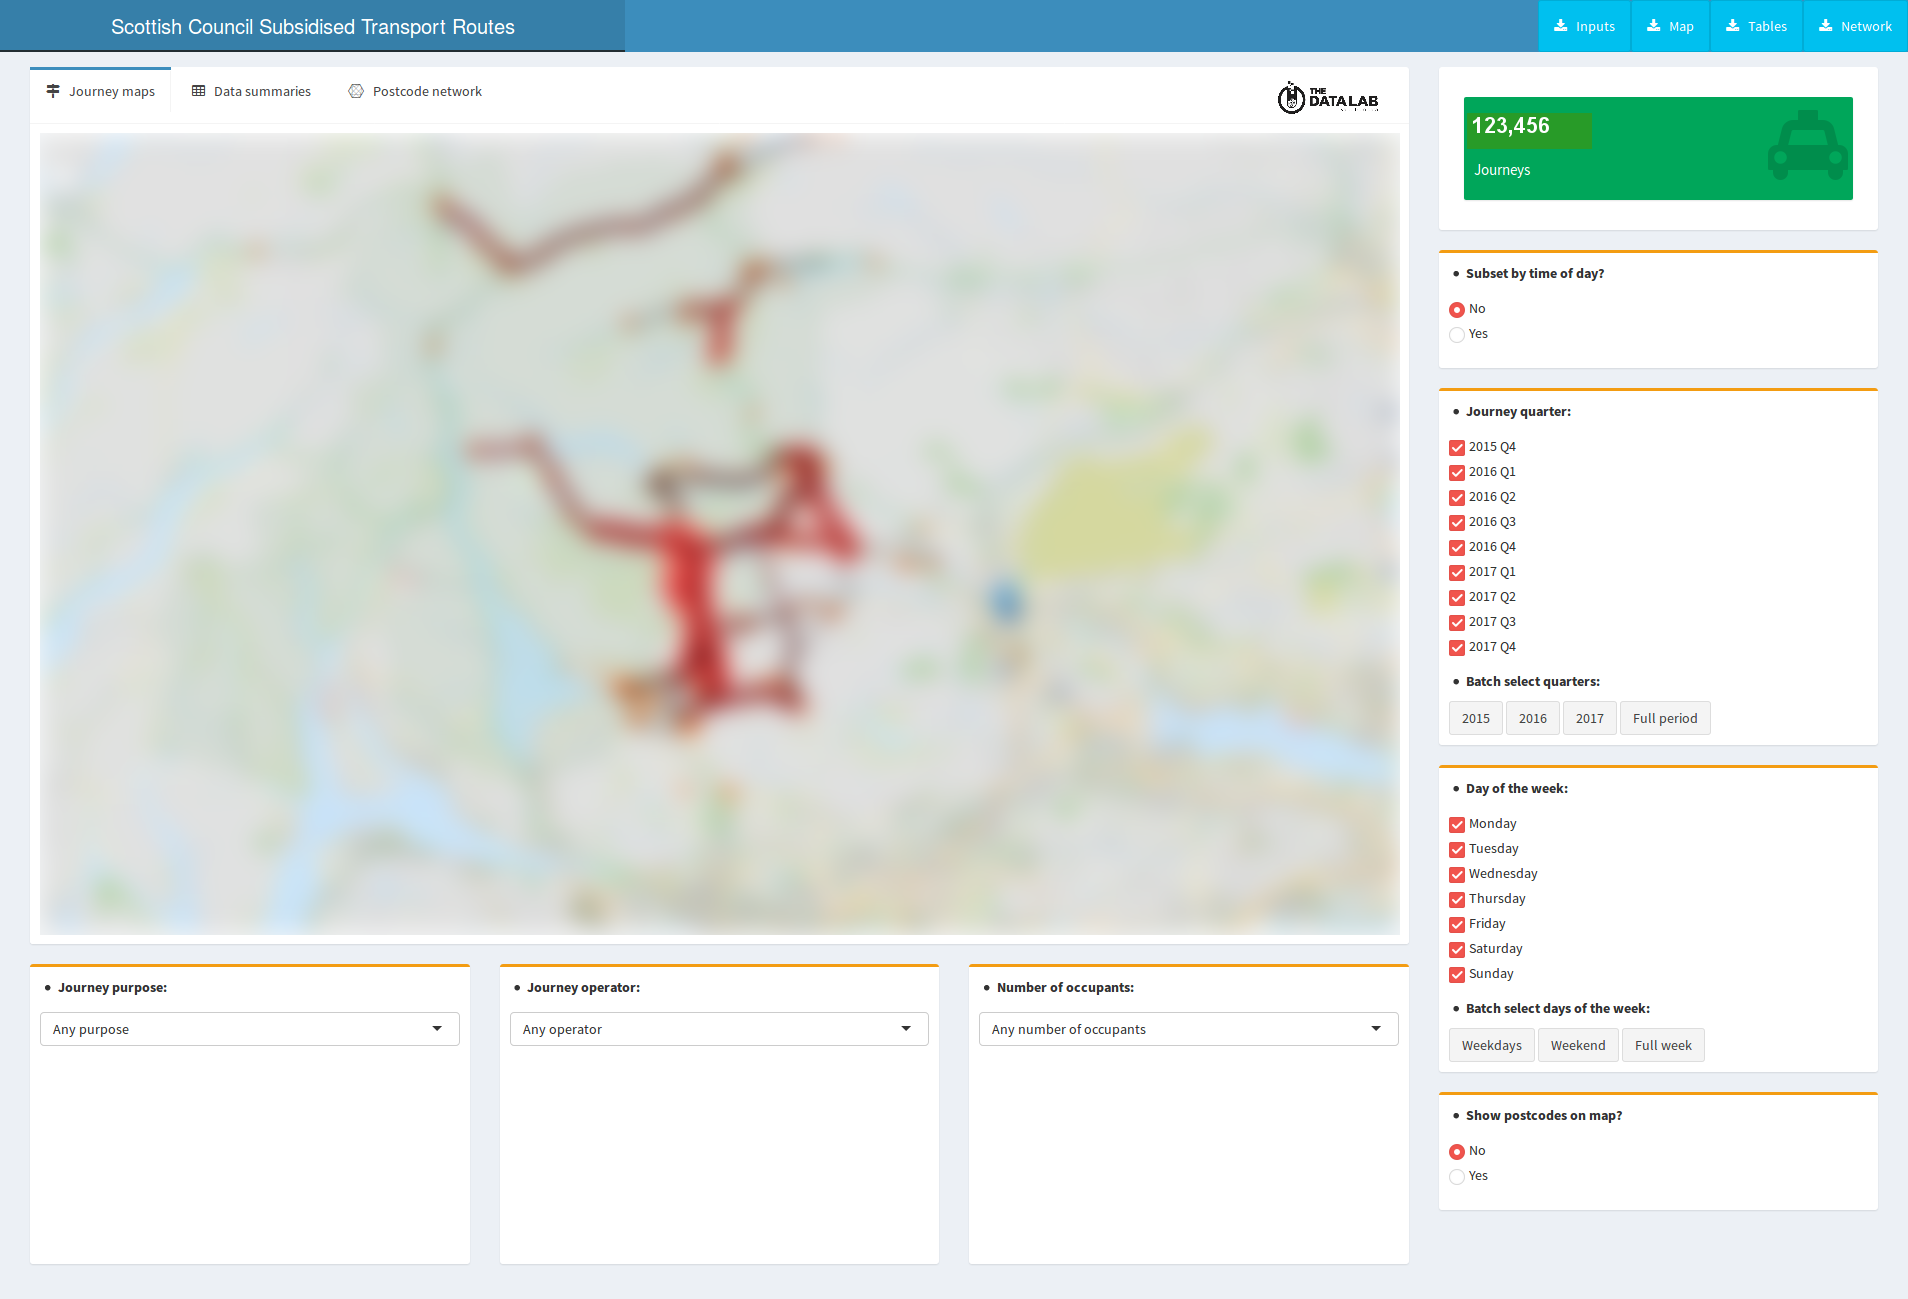
Given the richness of the data (collected across two years) and the multitude of (potential) influences on traffic volume, I created an interactive Shiny app. I then demoed the app at an EdinbR meeting. There it sparked a lot of interest and questions, so in the end it was decided to make the underlying R code widely available (however without the associated data - which we do not own) - see below for details.
What can you expect to see in the R code?
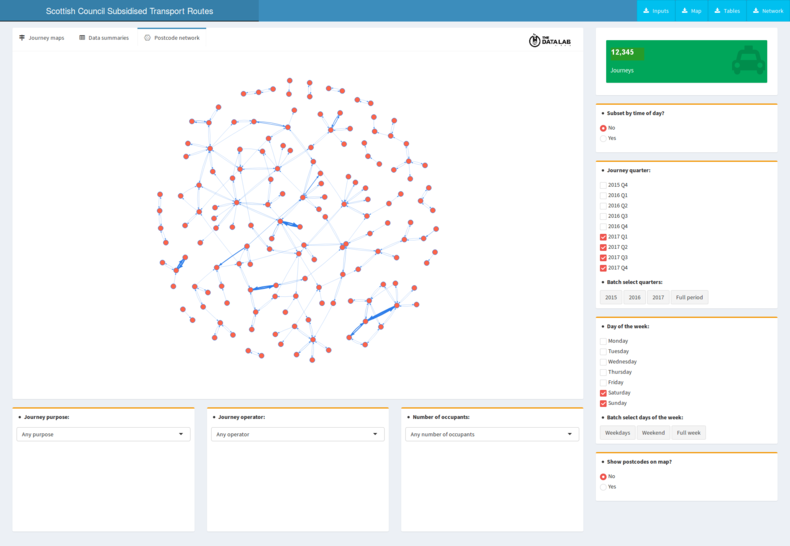
Prior to visualising the data within the Shiny app, it underwent some cleaning and transformations. Afterwards, I used the stplanr package (as well as the GraphHopper routing engine) to create the spatial lines connecting the origins and destinations (postcodes) for each unique journey.
After these necessary preliminary steps (which are not part of the code linked below), I was able to move on to creating the Shiny app itself. For that, other key packages I used include:
shinydashboard(for more flexibility in determining the look of the UI)DT(for beautiful, interactive tables)leaflet(for creating the interactive maps over which to plot the data)visNetwork(to visualise the network of postcodes between which people travelled).
Shiny app gist
Please note that in the absence of the original data, and having removed/modified certain lines of code, the script will not run as is. Rather, it is intended to help you see the structure of a Shiny app, which you can adapt for your own purposes if you please cite this work as:
Constantinescu, A.C. (2018, June). Exploring transport routes, journey characteristics and postcode networks using R Shiny [R script as GitHub Gist]. Edinburgh, Scotland: The Data Lab Innovation Centre. Retrieved [Month] [Day], [Year], from https://gist.github.com/CaterinaC/4fdfe9bfd753dd47bdec16ca342c401b
Hope this is of use! Remember you can always get in touch if you have questions or suggestions.
This content was first published on The Data Team @ The Data Lab blog.